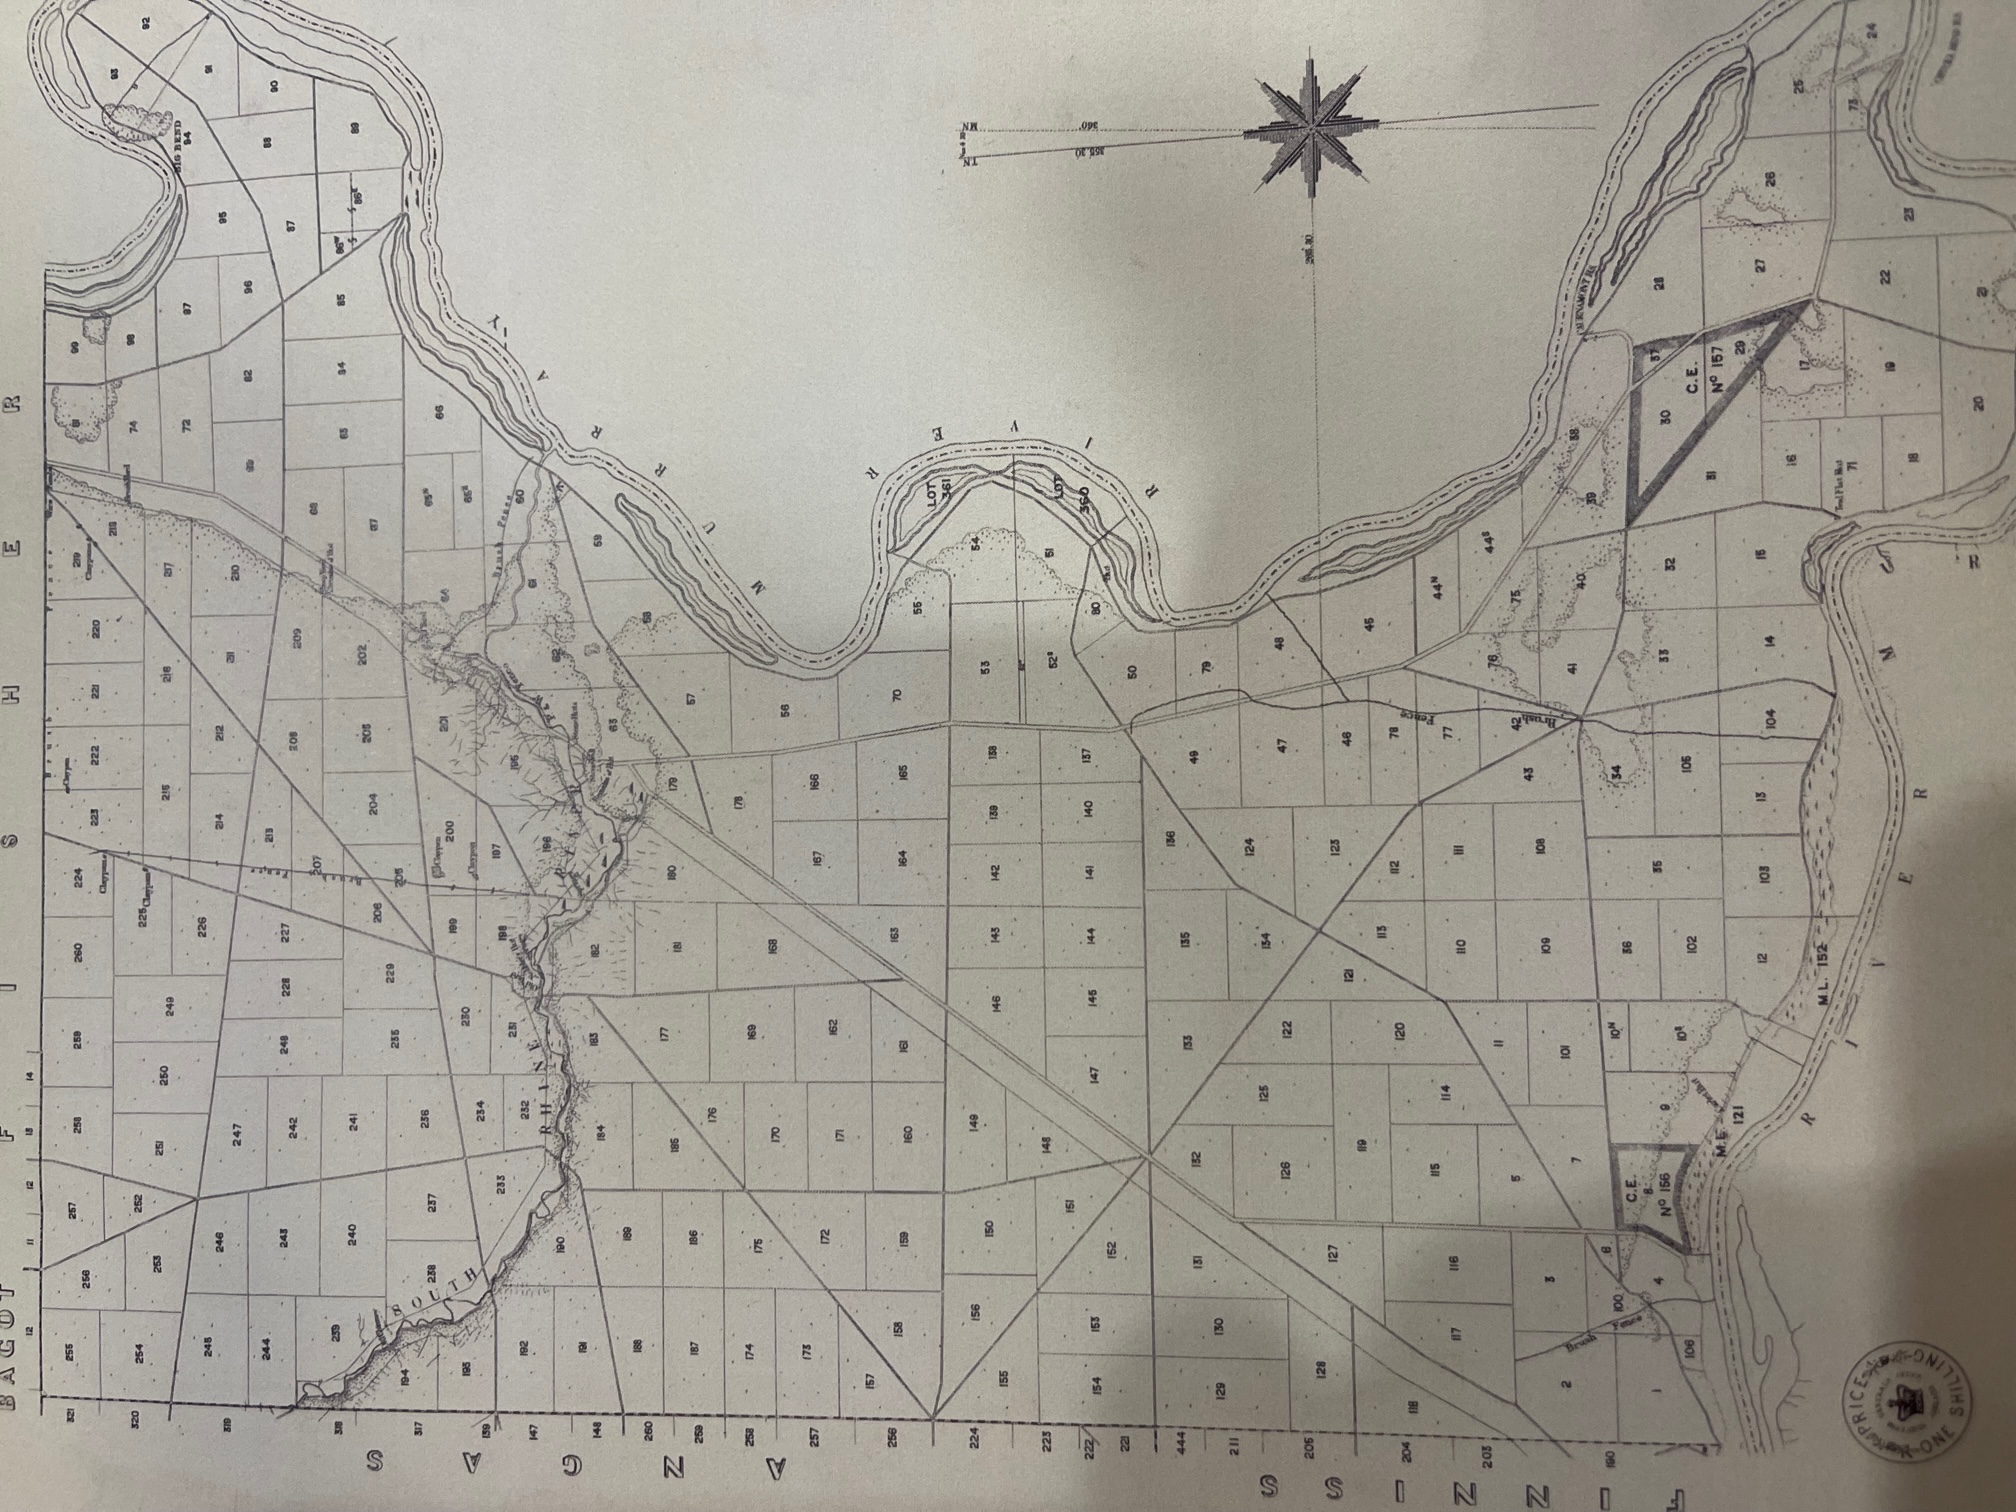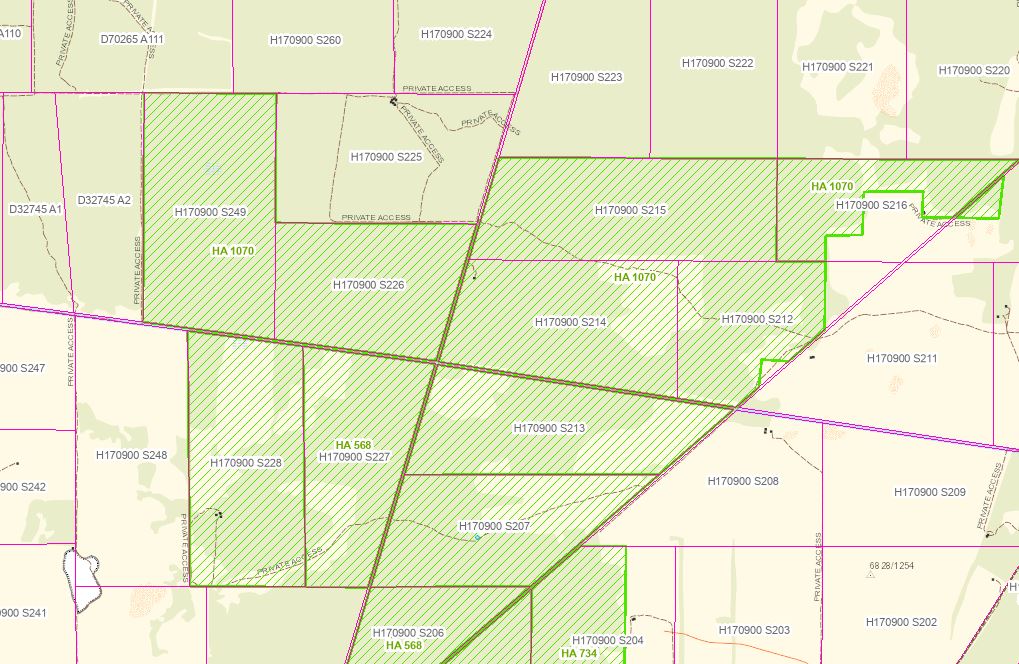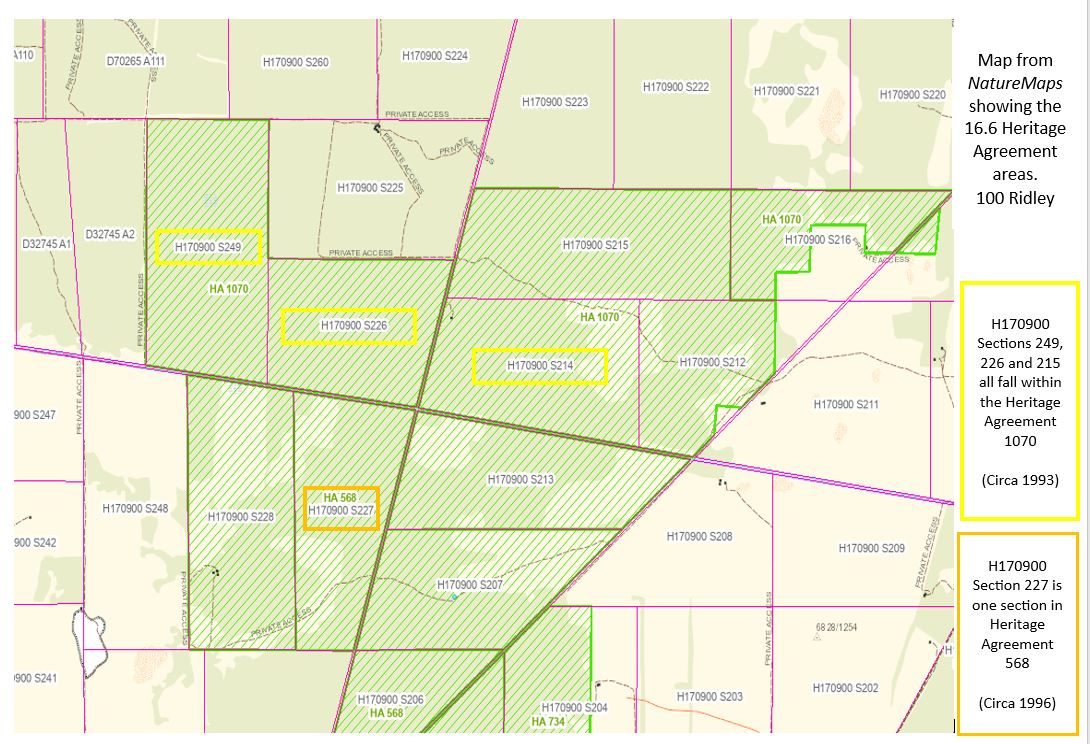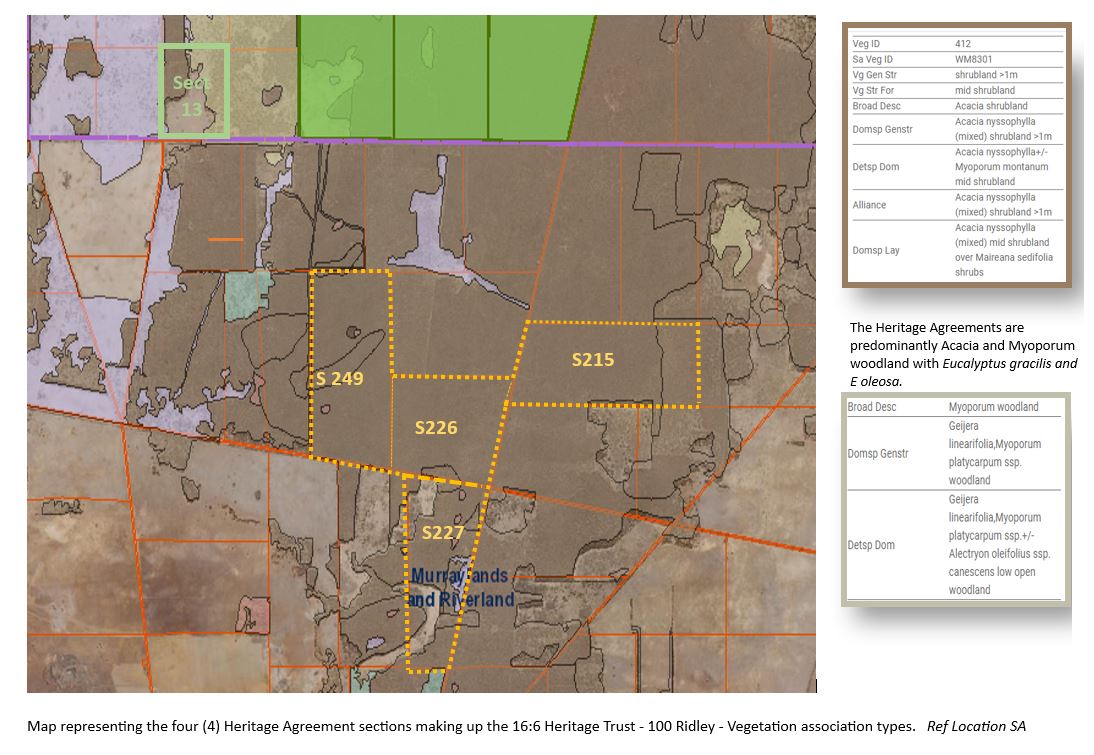
Maps are essential in creating easy-to-follow visual representations of complicated data, especially when the data has a spatial or specific (geographical) aspect. If you prefer colours and pictures over spreadsheets and words, then maps and charts are suitable options.
Maps help us identify areas of interest on and across 16:6, such as species diversity and density. In the bigger picture, they also assist decision-making by laying out key threats, populations, or target outcomes visually.
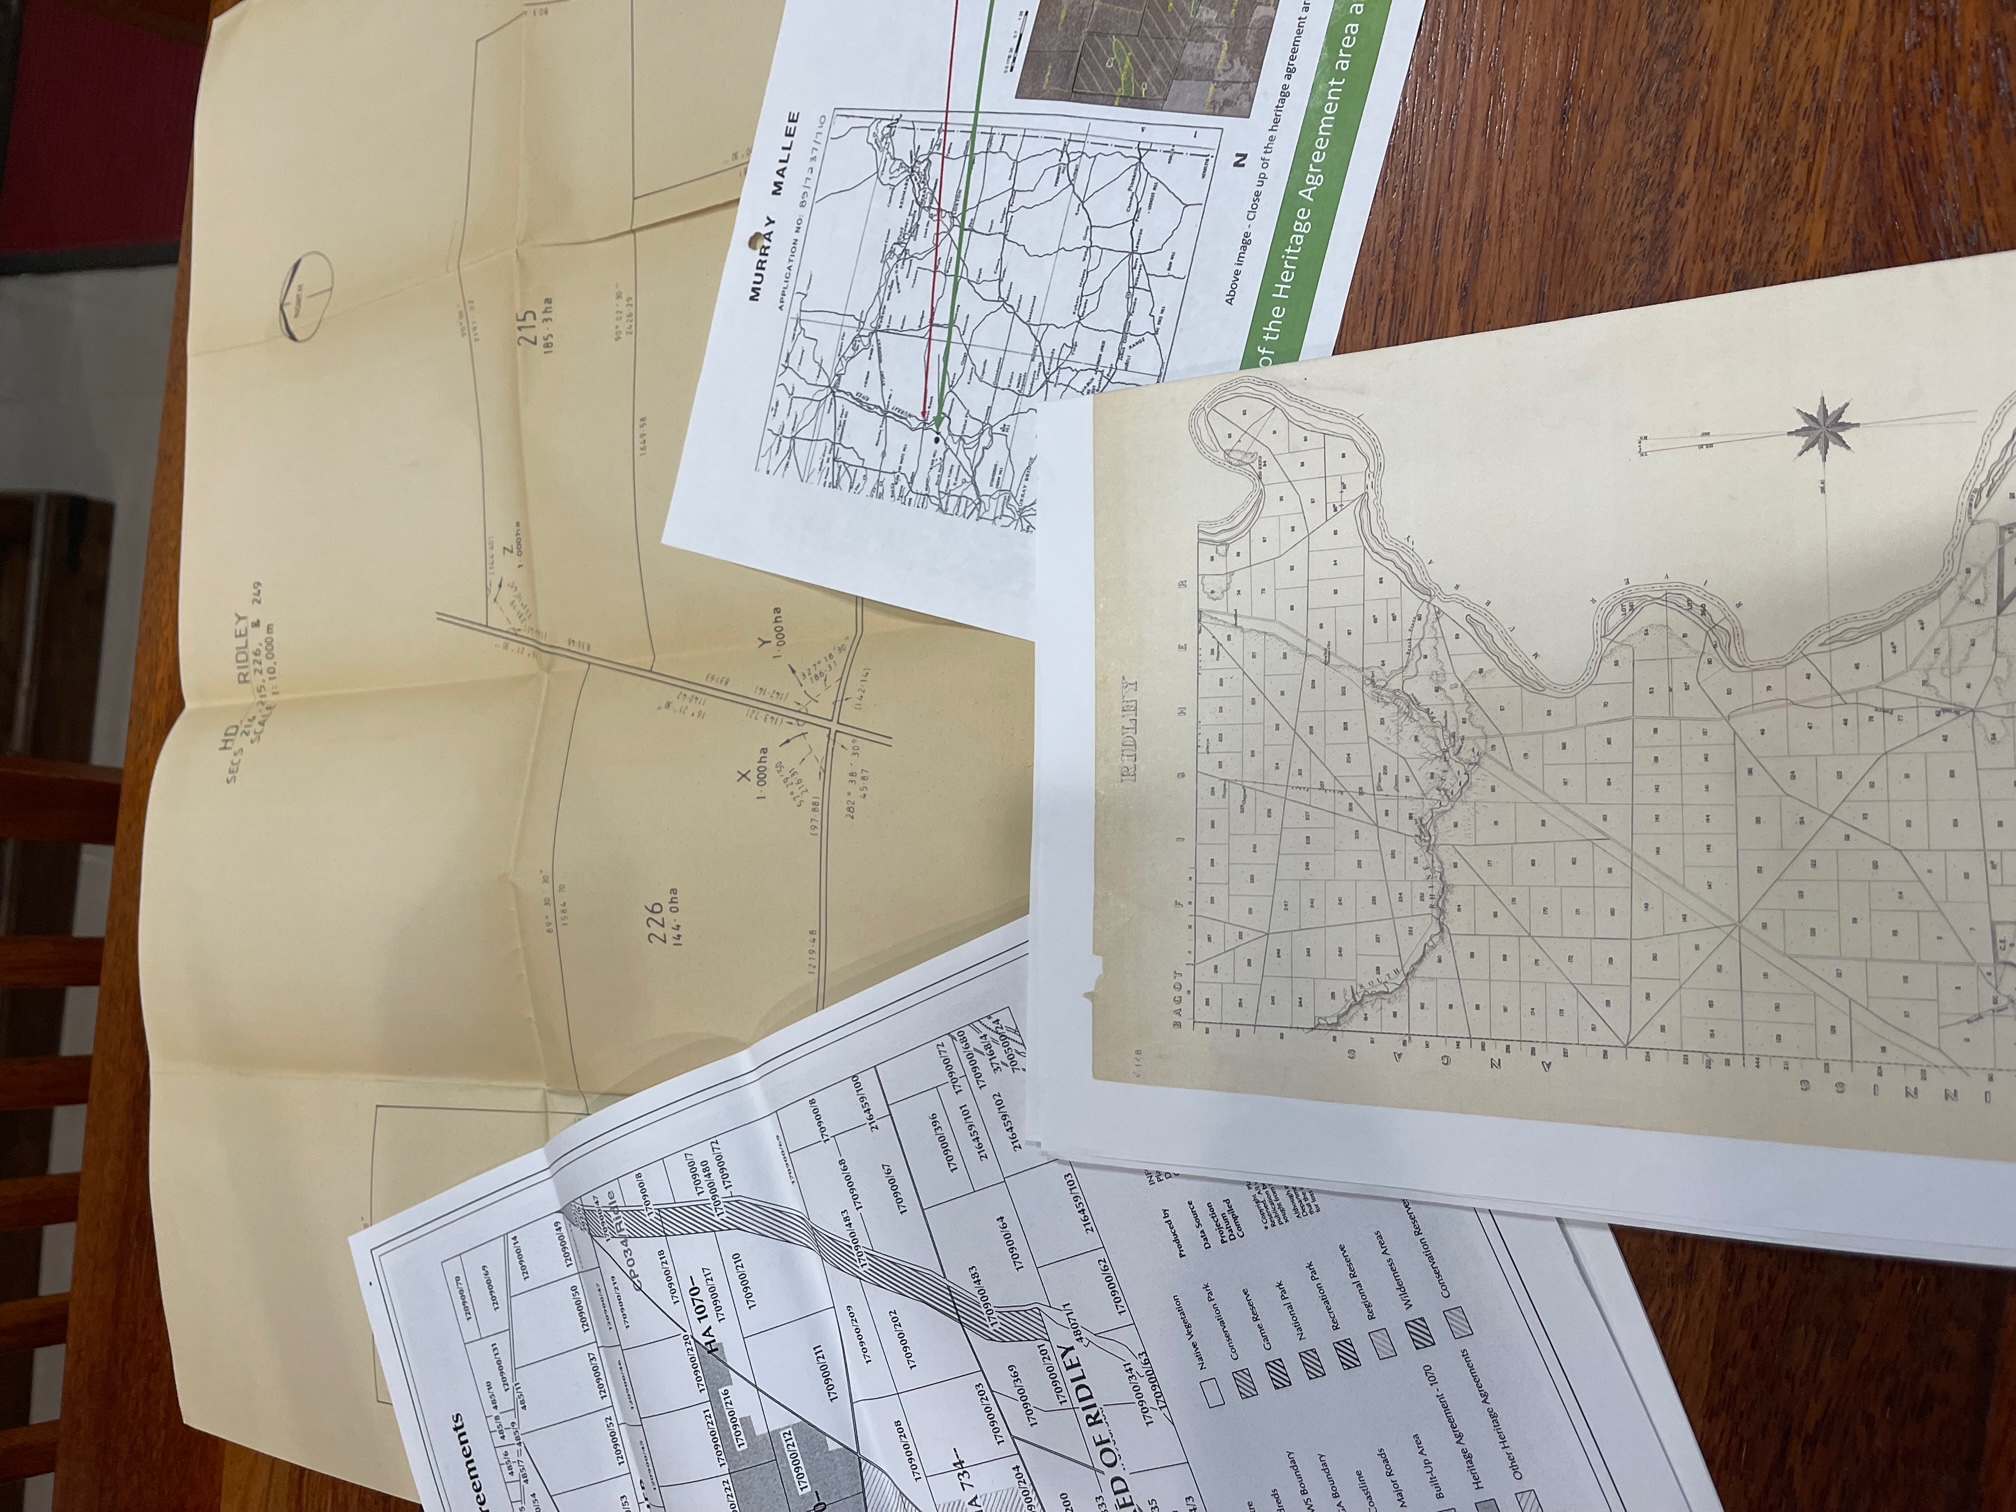
The maps that we have linked on this site include the following areas:
- Geographical - road maps, property boundaries and locations (directions)
- Species information - plotting and location of flora and fauna
- Historical maps based on online historical searches ( Web-based sites)
- Some Photographic (i.e. aerial images) to assist in the identification of change over time
- Weed mapping or exotic species mapping for management of threats and inclusion
- Identification of GPS points and pins for clarity
At this stage, this mapping tab is not interactive. However, we are working to look at links that may allow for interactive access.
This page is developing as we gain a better understanding of the use of a range of excellent online tools such as NatureMaps, GPS Tracks and iNaturalist
One thing to note is that when we map on publically available sites, including iNat, Nature Maps, Feral Scan, and even the Atlas of Living Australia, we may opt to obscure the species' GPS data or make it approximate. This is to protect the exact locations of species from being identified.
If in doubt, we note that the species seen has occurred in the area referred to as the Swan Reach Conservation Park.
Please watch this space as we learn and share, and please feel free to link in with us and join the learning journey by helping us use mapping resources better.